

MWRD-GC Dashboard
MWRD-GC Dashboard (or Dashboard) is a Web-based system for integration of heterogeneous combined sewer overflow (CSO) data, related water level and quality data, and various meteorological datasets. It provides visual access to the spatial and temporal dimensions of the data, enabling improved understanding of the impacts of hydrometeorology and management decisions on CSOs, TARP, and connected waterways. Based on this research, the project delivered a Web-based tool that enabled automated creation of storm-scale animations of CSO occurrences. This tool was based on technology such as DataWolf (https://datawolf.ncsa.illinois.edu) at NCSA.
Learning from Geospatial Data and Images:
GeoLearn

GeoLearn has been prototyped as a novel simulation and exploratory environment for prediction modeling from remote sensing imagery, and large size geospatial raster and vector data. The GeoLearn framework has the functionality to read data sets from local and remote sites, extract features like slope from elevation; mosaic tiles; perform quality assurance of remotely sensed images, integrate images, spatially select pixels by masking with boundaries, geo-points, maps with categorical variables, threshold maps with continuous variables or painted regions using primitives, extract pixels over a mask, perform data-driven modeling using machine learning techniques, provide interpretation of models in terms of variable relevance and visualize a variety of input, output and intermediate data.
Algal Biomass Prediction

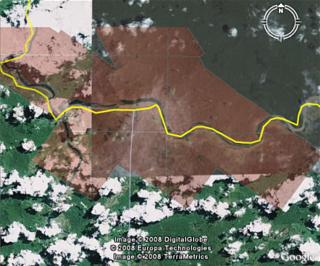
In our project visualization and data mining tools are applied to Algal biomass prediction in Illinois streams. The problem of algal biomass prediction in Illinois streams lies in explaining the variability in algal biomass measured as chlorophyl a, based on nutrients (total or dissolved nitrogen, and total or dissolved phosphorus) and other variables (water velocity, canopy cover along the streambank, stream width/depth, etc.). Algae are either the direct or indirect cause of most problems related to nutrient enrichment. Overlay of the elevation map of Illinois and the Algae predicted values at water station locations (right). This project was supported by the National Science Foundation and National Center for Supercomputing Applications.
Groundwater Recharge and Discharge Modeling

We focused on the problem of modeling groundwater recharge and discharge rates. The phenomena related to groundwater recharge and discharge result from a set of complex, uncertain processes and are generally difficult to study. We provide test data to illustrate how to incorporate and mine slope, soil type and proximity to water bodies for predicting groundwater recharge and discharge (R/D) rate models. The joint research of NCSA and Illinois State Water Survey (ISWS) combines the computer science and ground water science expertise, and leveraged numerical methods and image processing algorithms to efficiently estimate R/D rates. The results of our joint research help hydro-geologists to better understand zonation delineation. The work in progress is being tested against an intensively studied field site in Wisconsin and it will be applied immediately to several groundwater studies in northeastern Illinois. Spatial Pattern to Learn (Sp2Learn) software presents a framework for accurate estimation of geospatial models from sparse field measurements using image processing and machine learning.
Costa Rica 2050: Web-Enabled Access to Integrated Large Size Airborne Imagery of Costa Rica
The project of visualization and analysis of the aerial land images of Costa Rica, obtained from the CARTA 2003 and CARTA 2005 missions is part of a broader initiative called the Advanced Research and Technology Collaboratory for the Americas (ARTCA). Activities of researchers from the Instituto Tecnologico de Costa Rica (ITCR), Centro Nacional de Alta Tecnología (CeNAT), National Center for Supercomputing Applications (NCSA) and universities are coordinated by CeNAT in Costa Rica.
Bicentennial celebration of Abraham Lincoln’s birth
With the bicentennial celebration of the birth of Abraham Lincoln in 2009, our work was motivated by delivering the information about Abraham Lincoln’s life to scientific and educational communities. Many Lincoln documents have already been studied and made available to the public through books, monographs, and initiatives, some of which are available online in Library of Congress, Abraham Lincoln Presidential Library, The Papers of Abraham Lincoln and The Collected Works of Abraham Lincoln. The existing virtual spaces accessible via the Internet usually do not provide a comprehensive view of the fast growing amounts of digital information about Lincoln’s life. Our objective is to integrate heterogeneous data sources in a virtual observatory and provide access to temporal, spatial and contextual dimensions of the underlying large volume of data. The overall project to digitize, store, and make publicly available all Lincoln writings is a joint effort of multiple institutions, including NCSA, the Illinois Historic Preservation Agency, and the Abraham Lincoln Presidential Library and Museum.

As part of this project, the design of the virtual observatory has two major objectives. The scientific objective reflects our broader interest in manipulation and image processing of terabytes of data. The educational objective aims at making the documents accessible to the general public, students and scholars through the web-based interface. The advanced information delivery system supports data browsing, text query-based searching, geospatial data retrieval and visualization, and transcription services for transcribing image scans of handwriting to text.
Remote Dance, TEEVE
Joint performance of dancers from two remote sites, UC Berkeley and University of Illinois at Urbana-Champaign.

Wheelchair Basketball Coaching
PHYSNET Project: Physical Interaction Using the Internet – The Virtual Coach Intervention
In a tele-immersive environment the learning of shooting and other techniques (e.g. hook pass, figure eight dribble, one-on-one defense) allows for minimal physical interaction with other players, minimizing the likelihood of injuries. In addition all players, regardless of location, can be closely supervised by a coach. For this work we colaborate with Mike Frogley, a headcoach of men’s and women’s basketball teams at the University of Illinois.

Digital Synthesis Environment (DSE): Weather prediction for US between 1871 and 2005

An on-line weather prediction system illustrates on-demand weather interpolations over time and space from measurements acquired at US weather stations integrated with a web publishing mechanism. The on-line demonstration is available at http://isda.ncsa.uiuc.edu:8080/dse/index.html.
Motivation: A scientist develops a set of algorithms to interpolate weather data, designs interpolation algorithms, processes data, and publishes a paper on the new interpolated data set. This scientist then shares the work with others by publishing a live service so that other users may execute the same or modified analyses leading to new results. Not only does the live service enable other researchers to use the interpolation, sub-setting, and visualization services, but it also makes the research results available for both knowledge integration and pursuing more complex research.
Understanding Computational Requirements of Preservation and Reconstruction
We focused on evaluating the information value, data volumes and computational requirements during decision making processes. The problem is stated as information gathering about decision processes using geospatial electronic records and described in more details below. Our work addresses the tradeoffs of electronic information preservation in terms of file format, data volumes and computational requirements. The government makes a large number of high-confidence decisions using geospatial electronic records. Decision makers might process maps and photographs called raster data, vector data that represent linear features like county boundaries or streams, and statistics in tabular form to arrive to a decision that affects the lives of many citizens. The problem is to document, preserve, and reconstruct the processes later, often years after the initial decision has been made.
Cyberintegrator – Lowering Adoption Barriers of Workflow Systems

Cyberintegrator is a highly interactive environment to support and address the many needs of scientific processes. It was created at the National Center for Supercomputing Applications. The ultimate goal is to support scientific discoveries and to provide means for conducting research more efficiently. Development evolved from the Environmental Cyberinfrastructure Demonstrator (ECID) project to support environmental engineering, science and hydrology research with the help of Technology Research Education and Commercialization Center (TRECC).
Cyberintegrator is a user friendly editor to several middleware software components that (1) enable users to easily include tools and data sets into a software/data unifying environment, (2) annotate data, tools and workflows with metadata, (3) visualize data and metadata, (4) share data and tools using local and remote context repository, (5) execute step-by-step workflows during scientific explorations, and (6) gather provenance information about tool executions and data creations.
3D Medical Volume Reconstruction for Fluorescent CLSM
. Registration and Cross Section Alignment Tool.")
We present a problem of three-dimensional volume reconstruction from fluorescent confocal laser scanning microscopy (CLSM) imagery. We overview a three-dimensional volume reconstruction framework which consists of volume reconstruction procedures using multiple automation levels, feature types, and feature dimensionalities; a data-driven registration decision support system; an evaluation study of registration accuracy, and; a novel intensity enhancement technique for 3D CLSM volumes.
The motivation for developing the framework came from the lack of 3D volume reconstruction techniques for CLSM image modality. The 3D volume reconstruction problem is challenging due to significant variations of intensity and shape of cross sectioned structures, unpredictable and inhomogeneous geometrical warping during medical specimen preparation, and an absence of external fiduciary markers. The framework addresses the problem of automation in the presence of the above challenges as they are frequently encountered during CLSM-based 3D volume reconstructions used for cell biology investigations.
Tools for registration and alignment:
Alignment Tool 1: Transformation Selection (Blood vessels)
Alignment Tool 2: Image Size Selection
This project is a collaboration between NCSA and Department of Pathology, University of Illinois at Chicago and is supported by the National Institute of Health and National Center for Supercomputing Applications.
Large Size Multi-Modal 3D Medical Imagery

Large size datasets from Magnetic resonance imaging (MRI) microscopy and 3D diffusion tensor (DTI) weighted fiber tracking imagery are integrated to produce the neuron-anatomical model of song bird. A zebra finch (Taeniopygia guttata) is an ideal animal model since the auditory behavior, the neural pathways, the genomic profile, and the neural pathways for sound generation are similar to humans. The joint research of NCSA and College of Applied Life Studies; (ALS) combines the computer science and bio-medical expertise not only to understand neuron-anatomical model but also to test hypotheses about efficient diagnoses from multi-modal imagery. High resolution MRI images of the zebra finch brain and 3D diffusion tensor weighted fiber tracking imaging were fused with serial cyto-histological sections of the complete brain of a male and female Zebra finch.
DNA Microarray data processing

The goal of microarray image analysis is to extract intensity descriptors from each spot that represent gene expression levels and input features for further analysis. Biological conclusions are then drawn based on the results from data mining and statistical analysis of all extracted features. The workflow of microarray data processing starts with raw image data acquired with laser scanners and ends with the results of data mining that have to be interpreted by biologists. The microarray data processing workflow includes issues related to (1) data management (e.g., MIAME compliant database, (2) image processing (grid alignment, foreground separation, spot quality assessment, data quantification and normalization, (3) data analysis (identification of differentially expressed genes, data mining, integration with other knowledge sources, and quality and repeatability assessments of results, and (4) biological interpretation (visualization). The main objective of this project is related to image processing, namely grid alignment, foreground separation, spot quality assessment, data quantification, normalization and visualization.
ECHO – Electronic Children Health Observatory

The purpose of our project is to develop and pilot a state-wide, state-of-the-art student personal health record tracking system called ECHO (Electronic Children Health Observatory) that can screen and track childhood obesity, as well as provide intervention if needed, for the State of Illinois.
There are three specific aims in this study:
(1) To complete the development of the major system architecture of ECHO and its application elements,
(2) To pilot the system in different application settings and to evaluate the efficiency and utility of the system,
(3) To modify the system based on the feedback, develop instructions for the future implementation of the system and estimate the cost of the implementation.
Analysis of Hyperspectral Images

Part of this project is a development of a new methodology for hyperspectral band and method selection using unsupervised and supervised methods driven by classification accuracy and computational cost. The problem is formulated as follows: Given N unsupervised band selection methods and M supervised classification methods, how would one obtain the optimal number of bands and the best performing pair of methods that maximize classification accuracy and minimize computational requirements?
Unsupervised methods for band selection: Unsupervised methods order hyperspectral bands without any training and the methods are based on generic information evaluation approaches. Unsupervised methods are usually very fast and computationally efficient. These methods require very little or no hyperspectral image pre-processing. For instance, there is no need for image geo-referencing or registration using geographic referencing information, which might be labor-intensive operations.
Methods are: 1. Information Entropy, 2. First Spectral Derivative, 3. Second Spectral Derivative, 4. Contrast measure, 5. Spectral Ratio Measure, 6. Correlation Measure, 7. Principal Component Analysis Ranking (PCAr)
Supervised methods for band selection: Supervised methods require training data in order to build an internal predictive model. A training data set is obtained via registration of calibrated hyperspectral imagery with ground measurements. Supervised methods are usually more computationally intensive than unsupervised methods due to an arbitrarily high model complexity and an iterative nature of model formation. Another requirement of supervised methods is that the number of examples in a training set should be sufficiently larger than the number of attributes (bands, in this case). If taken alone, the unsupervised methods can, at best, be used to create classes by clustering of spectral values followed by assigning an average ground measurement for each cluster as the cluster label. Supervised methods therefore provide more accurate results than unsupervised methods.
Methods are: 1. Regression, 2. Instance based (k-nearest neighbor), 3. Regression tree algorithms
The hyperspectral image data used in this work were collected from an aerial platform with a Regional Data Assembly Centers Sensor (RDACS), model hyperspectral (H-3), which is a 120-channel sensor developed by NASA.
Hyperspectral Image Data Mining for Band Selection in Agricultural Applications
Precision farming practices are conceptually based on within−field variability information. Modern sensing technologies including remote sensing for information gathering results in large volumes of raw data. Remote sensing can provide high−resolution data on geospatial variability in yield−limiting soil and crop variables. It can be used for mapping soil characteristics, leaf area index (LAI), crop development, canopy coverage, pest infestation, plant water content, and crop stresses Lack of data mining tools and inability of agriculture producers and consultants to extract useful information from large volumes of raw data on yield−limiting factors is a major hurdle in the widespread application of remote sensing at production level.

Hazard Aware Environments: Robotic Teleoperation

This work addresses a set of general problems during a design of smart spaces. The problems are related to knowing where sensing takes place, at what time, of what measurement type and what the interpretation of acquired measurements is for event detection, recognition and proactive event-driven action purposes. The work outlines multi-instrument and sensor measurement systems that provide sensing capabilities for smart spaces, as well as theoretical and practical limitations that have to be understood while working with novel sensing technologies. The disparate sensing systems include wireless micro-electro-mechanical systems (MEMS) sensor networks (such as MICA sensors by Crossbow Inc.) and cameras that capture a variety of spectra (such as visible, thermal infrared and hyperspectral information). The sensors represent a mobile system over both time and space by engaging a robot with its robotic arm. The robot performs remotely controlled sensor deployment, and adaptive sensor placement based on the sensing feedback. Our solution addresses: 1) robotic sensor deployment using various human-computer interfaces, 2) synchronization of sensors and cameras, 3) localization of sensors and objects by fusing the acoustic time-of-flight, 4) localization and vision stereo approaches, 5) mutual calibration of measurements from sensors and cameras, 6) proactive camera control based on sensor readings, and 7) hazard detection and understanding. Our prototype solution demonstrates primarily the integration of data across disparate sensing systems over both time and space.
Environmental Modeling
The project of visualization of the environmental water quality system. The map and dashboard interfaces show locations of the measuring stations and corresponding data overview. The dashboard allows for viewing of either the extreme (min/max) sampled values or all the sampled values for a chosen location. The visualization is based on both real-time and historical data.